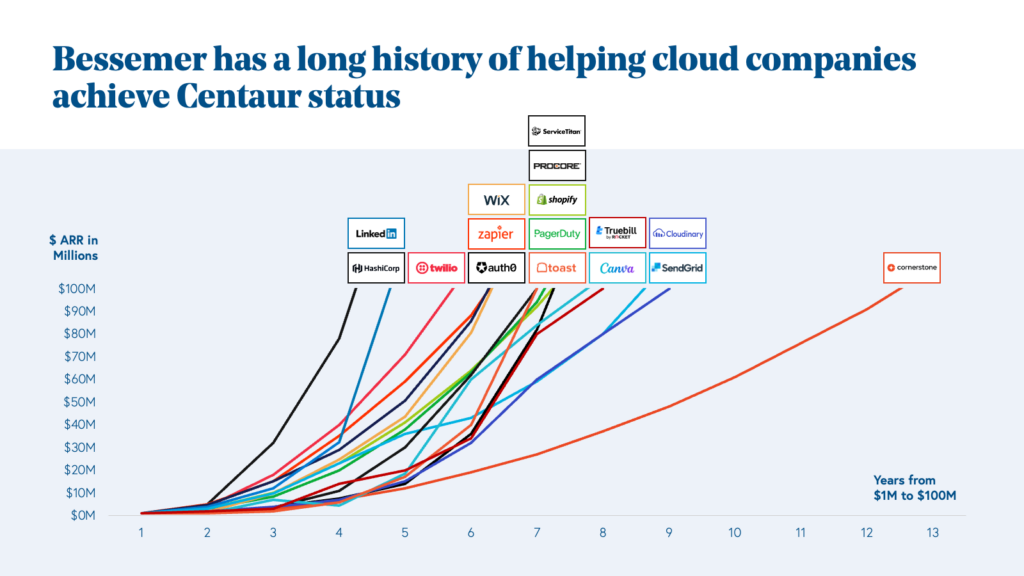
Early-stage VC investors are interested in investing if they believe you have a shot at making a one billion exit with them on board as a minority investor. This means you must build a company with an ARR of a hundred million or more within five to eight years, which is possible. Just consider this chart from BVP tracking the time it has taken some of their portfolio companies to grow ARR from one million to a hundred million.
SaaS KPIs measuring capital efficiency
Several useful KPIs are used to track a SaaS start-up’s capital efficiency, such as:
- Gross Margin. Tracks how much profit is left after directly servicing customers to pay for indirect costs like sales and marketing, product development, R&D, and administrative expenses
- CAC Payback. Tracks how many months it takes to pay back the acquisition costs to win a new customer
- LTV / CAC Ratio. Tracks the ratio of customer lifetime value to the cost of acquiring a new customer
- Magic Number. Tracks the ratio between net new ARR generated and the sales and marketing costs in a given period
- Quick Ratio. Tracks the ratio between the sum of new ARR and expansion ARR to the sum of downgrade ARR and churn ARR in a given period
- Efficiency Score. Tracks the ratio between net ARR growth and net cash burn in a given period
- Rule of 40. Tracks the sum of ARR growth percentage and the percentage of free cash flow to ARR
- Cash Conversion Score. Tracks the ARR to total capital raised and used
The Magic Number, measuring the efficiency of sales and marketing costs on the growth of net new ARR in a given period, helps make tactical decisions. The first SaaS KPIs above help set and evaluate tactical goals. The last few KPIs are useful for assessing performance over a more extended period. As we are interested in building up to a large exit, I’ve compared changes to the forecasted efficiency score with its impact on the founders’ ownership at different funding rounds.
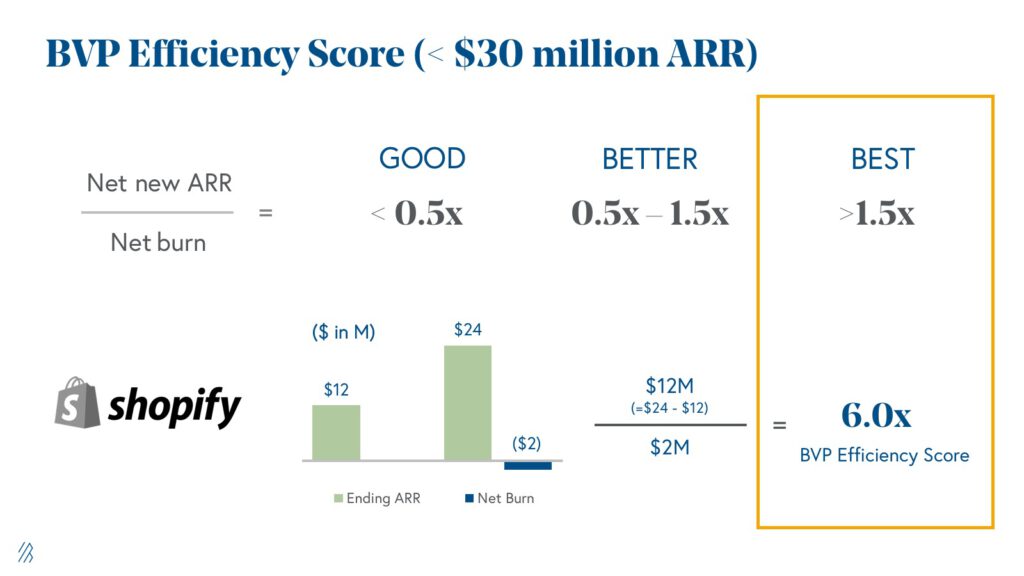
The efficiency score is defined as “Net new ARR / Net cash burn”
In a given period, net new ARR is the net impact of new and upsell offset by churn and downgrades, and net cash burn is the free cash flow spent in your operations. Do not include capital raised in a given period in this amount.
VC investors will contrast your efficiency score forecasts with similar start-ups they evaluate for investment and the scores achieved by publicly listed companies. BVP deems start-ups with an efficiency score above 1.5x in the best category. Such a start-up generates a net new ARR of 1.5 or more for every 1.0 spent in net operating cash flow.
Simulation of founder ownership % in various VC rounds and exit for different efficiency scores
You can forecast how much of your start-up you’ll have to sell at different times to raise the capital necessary to become a leader in your space. Strong growth momentum will help to attract the next round of investors and to find a strategic buyer when the time is right for an exit. Remember that there is a delicate balance between getting enough revenue growth and retaining enough ownership to attract the next round of VC investors. When preparing your growth forecasts, you must consider the minimum criteria investors consider necessary at different stages. Such as:
- Minimum ARR levels and growth rates for raising a Series A, Series B, and Series C round (see, e.g., Point9’s ‘What does it take to raise capital, in SaaS, in 2022?’)
- Founder ownership should ideally not be less than 50% at the time of a Series B
The dynamic simulation will give you an idea of which way you’re heading, given your current position and the different assumptions you make for the future of your SaaS start-up. You can scroll down to set all the input assumption boxes and see how your ownership changes in the last table.
Dynamic Simulation
TL;DR
Assuming a constant average ARR growth rate and an unchanging valuation multiple between VC rounds and the final exit, our simulation shows that:
- The efficiency score tracks how well you create net ARR growth versus the net cash burn to achieve this. An efficiency score of 1.5x means that your net new ARR increases by 1.5 for every 1.0 spent in net operating cash flow
- Efficiency scores below 0.8x create substantial dilution to founders compared to efficiency scores above 1.2x
- The multiples-of-invested-cash and IRR returns to investors remain attractive as they demand more shares for their larger cash investments when the efficiency score is low
- The concern to an investor is the lack of motivation of founders with small ownership stakes and the ability to attract new investors to a start-up with a low-efficiency score
- An efficiency score above 1.5x is a win-win situation for founders and investors alike